# Visual Order Mapping

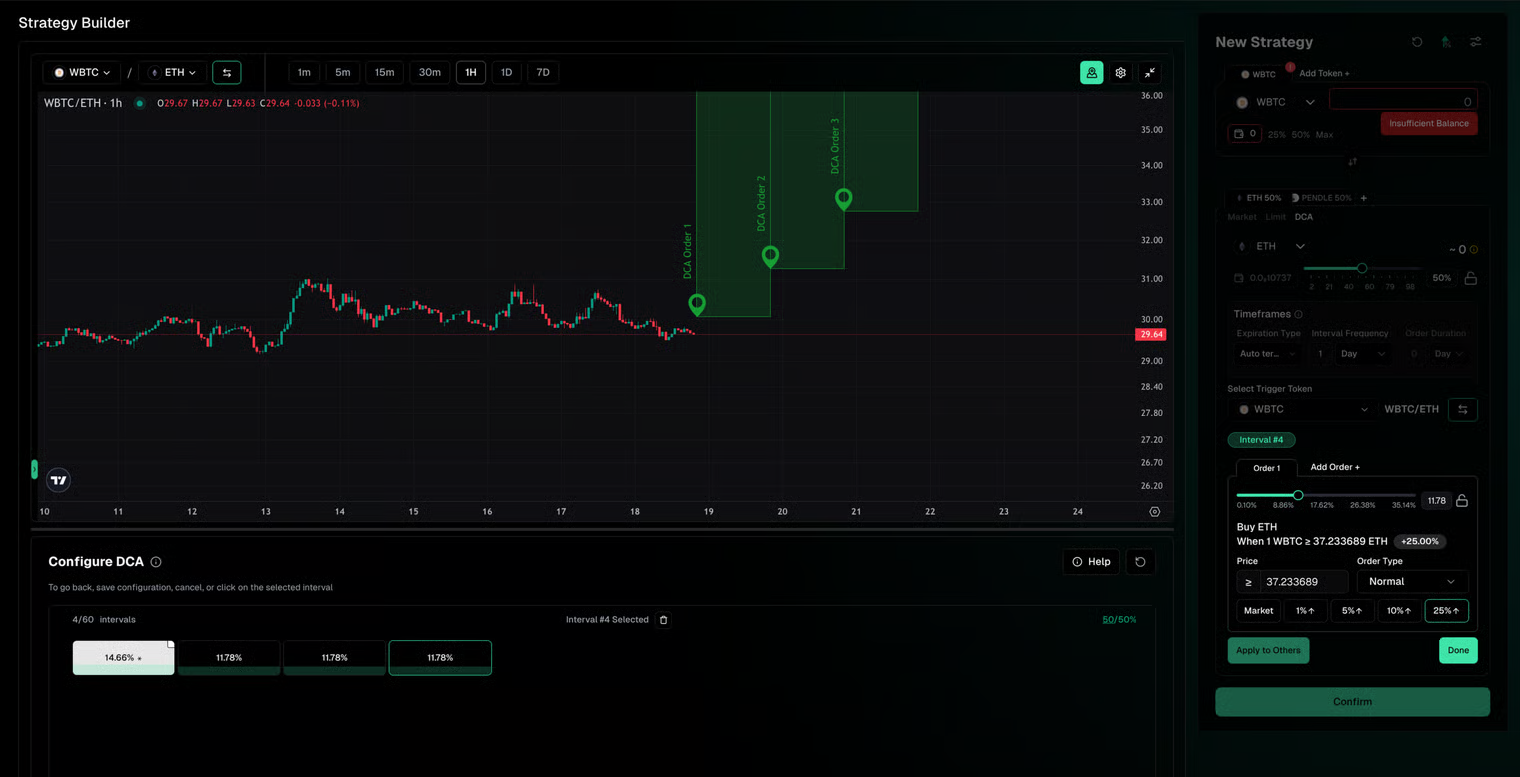
After adding an order to the Strategy builder that has a price and/or time condition set for it, it will get mapped onto the chart. &#x20;

Orders with a time range will be mapped at blocks:

<figure><img src="/files/1z2QUbPszdNlECliEkhQ" alt=""><figcaption></figcaption></figure>

Order with no time will be mapped as continous zones:

<figure><img src="/files/z31at2Z4fqW2eOIdxsFU" alt=""><figcaption></figcaption></figure>

Order with an exact time scheduled will be represented as a vertical line:

<figure><img src="/files/GfFngA5Y86h2RQqjdPYI" alt=""><figcaption></figcaption></figure>

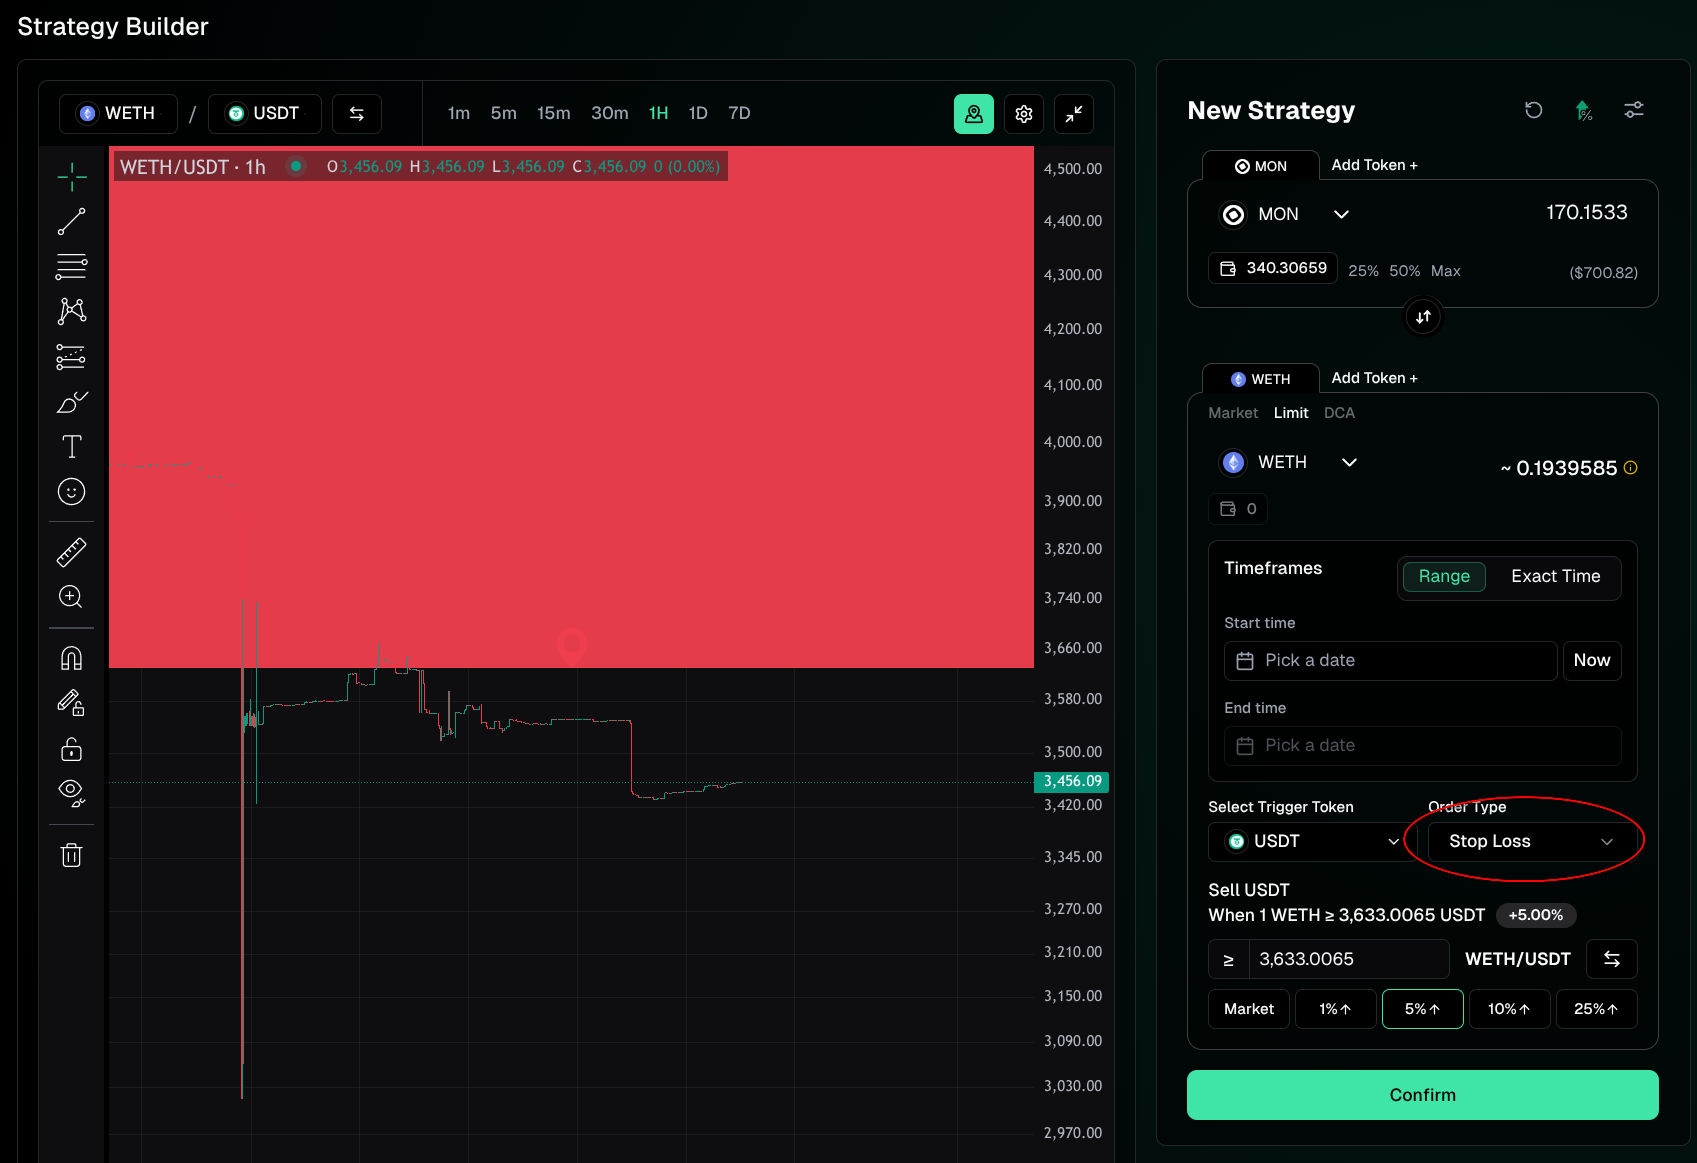
Stop Loss order (selling on the uncmmon side of the current market price) are represented in red:<br>

<figure><img src="/files/9om57MQ9tipn7Utg0Jeh" alt=""><figcaption></figcaption></figure>


---

# Agent Instructions: Querying This Documentation

If you need additional information that is not directly available in this page, you can query the documentation dynamically by asking a question.

Perform an HTTP GET request on the current page URL with the `ask` query parameter:

```
GET https://docs.sherpa.trade/sherpa-trade-automation/strategy-lab/visual-order-mapping.md?ask=<question>
```

The question should be specific, self-contained, and written in natural language.
The response will contain a direct answer to the question and relevant excerpts and sources from the documentation.

Use this mechanism when the answer is not explicitly present in the current page, you need clarification or additional context, or you want to retrieve related documentation sections.